
A Quantitative Model for Geopolitical Risk Premium in Semi Valuations
Geopolitics has moved from background noise to a central driver of semiconductor valuations. Export controls, regional subsidy races, onshoring mandates, and cross‑border M&A scrutiny all alter cash‑flow expectations and capital‑allocation decisions in ways traditional models often treat qualitatively, if at all.

This article outlines a practical, quantitative framework for estimating that premium. It does not claim to forecast political events; instead, it shows how to translate scenario thinking into an additive risk adjustment—systematic, repeatable, and transparent—that can be layered onto conventional DCF, multiples, and factor models when valuing semiconductor companies.
Why semiconductors require a distinct geopolitical premium
Not every sector is equally exposed to geopolitical risk. Semiconductors sit at a structural intersection of security, industrial policy, and global trade that makes them uniquely sensitive.
First, chips underpin defense systems, secure communications, and critical infrastructure. Governments therefore view access to key technologies—advanced logic, memory, RF, and power devices—as strategic assets, leading to export controls and localization drives.
Second, the supply chain is highly concentrated and geographically uneven. Leading‑edge wafer manufacturing, advanced packaging, and certain materials production cluster in a handful of regions, making political disruptions in any of them disproportionately impactful.
Third, industrial policy has become a major capital source. Subsidies, tax credits, and state‑backed funds influence where fabs are built, how capacity is expanded, and which companies become national champions. Policy reversals or regime changes can directly alter project economics.
These features mean that geopolitical risk is not a generic macro factor for semis; it is a sector‑specific driver that can materially affect revenue trajectories, margin profiles, capex, and discount rates. Formalizing it as a premium is therefore analytically useful.
Conceptual structure of the model
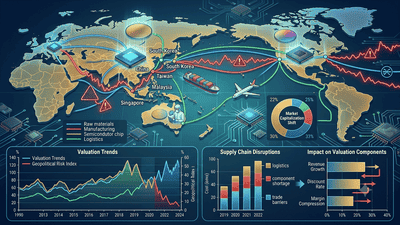
A quantitative model for geopolitical risk premium in semi valuations should meet three criteria: it must be modular, scenario‑driven, and company‑specific.
Modular. The geopolitical adjustment should sit on top of an existing valuation framework rather than replace it. You still start with base‑case cash‑flows, growth rates, and discount rates derived from business fundamentals; the geopolitical premium then modifies these inputs or adds an overlay.
Scenario‑driven. Because political events are inherently uncertain, the model must rely on structured scenarios with estimated probabilities, not single‑point forecasts. Each scenario maps to distinct cash‑flow impacts and valuation outcomes.
Company‑specific. Exposure differs markedly between firms—by product mix, geography, customer base, and supply‑chain footprint. The premium must be computed at the issuer level, not applied as a blanket sector adjustment.
At a high level, the model consists of four layers: (1) base valuation, (2) geopolitical factor identification, (3) scenario mapping and probability assignment, and (4) translation into a risk premium via either cash‑flow haircuts or discount‑rate adjustments.
Step 1 – Establish the base valuation
Begin with a conventional valuation for each semiconductor company, ideally using a DCF complemented by relative multiples:
- Forecast revenue by segment (logic vs memory, automotive vs consumer, foundry vs IDM vs fabless) across a 5–10 year horizon.
- Estimate operating margins, capex, and working‑capital needs based on technology roadmaps and competitive positioning.
- Choose a base discount rate derived from capital structure and market conditions, independent of explicit geopolitical adjustments.
This base valuation represents what the company is worth under “normal” macro and competitive conditions, assuming no major geopolitical disruptions beyond those implicit in historical data.
Step 2 – Identify key geopolitical risk drivers
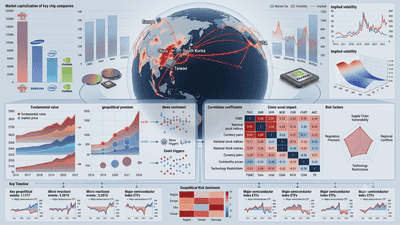
Next, identify the specific geopolitical drivers relevant to semiconductors and to each company in particular. Common drivers include:
Export controls and sanctions. Restrictions on selling certain nodes, tools, or IP to specific countries; potential bans on supplying technology to particular customers.
Regional subsidy and onshoring dynamics. Dependence on incentive schemes whose continuation may be uncertain; exposure to policy changes that could alter project NPV.
Cross‑border supply‑chain fragility. Reliance on fabs, OSATs, or materials in geopolitically sensitive regions; vulnerability to trade disputes or transport disruptions.
National security reviews of M&A and JV structures. Risk that strategic transactions will be blocked or forced to divest key assets.
Regime and governance risk. For companies with significant operations or partners in jurisdictions where rule‑of‑law or policy stability is weaker.
For each company, build a qualitative profile of exposure along these dimensions, then translate exposure into potential financial impact categories: revenue at risk, margin at risk, capex at risk, and cost of capital at risk.
Step 3 – Build scenarios and assign probabilities
With drivers identified, construct discrete scenarios capturing plausible geopolitical paths over your valuation horizon. A typical structure might include:
Scenario A: Status quo / mild tension. Current export controls remain; incentives continue broadly as planned; no major new barriers arise. Probability often highest but not 100%.
Scenario B: Moderate escalation. Additional controls on certain tools or nodes; tightening of subsidy regimes; isolated supply‑chain disruptions or forced reshoring for specific customers.
Scenario C: Severe disruption. Major regional conflict or sanctions; substantial loss of market access; abrupt termination of subsidies; extended shutdowns or nationalizations.
Each scenario must be accompanied by rough probability estimates. These are inherently judgmental but should be consistent across companies for shared macro drivers, with firm‑specific adjustments reflecting differentiated exposure.
Importantly, probabilities should be revisited periodically as news and policy developments unfold, making the model dynamic rather than static.
Step 4 – Translate scenarios into financial adjustments

For each scenario and each company, estimate the quantitative impact on key valuation inputs. Examples:
Revenue impact. Percentage of sales from markets that could be restricted; sensitivity of volumes to export bans; timing of potential bans or restrictions.
Margin impact. Changes in cost structure due to forced reshoring or lost scale; pricing pressure if subsidies expire; increased logistics or compliance costs.
Capex and project economics. Adjustments to planned fabs and packaging plants if incentives are cut or if political risk raises required returns; delays or cancellations of major projects.
Discount‑rate impact. Upward adjustments to the cost of equity or debt to reflect increased uncertainty and potential volatility under more severe scenarios.
These impacts can be expressed as multipliers or deltas relative to the base case. For instance, under Scenario B, you might haircut projected revenue by 10% in certain segments after year 3, increase opex by 3% to reflect compliance and duplicated capacity, and add 50 basis points to the discount rate. Under Scenario C, the haircuts and discount‑rate adjustments would be more severe.
Step 5 – Compute scenario‑weighted valuations
Using the adjusted inputs, compute a valuation for each scenario. Then, form a probability‑weighted expected value:
- 𝑉 𝐴 V A = valuation under status‑quo scenario.
- 𝑉 𝐵 V B = valuation under moderate escalation.
- 𝑉 𝐶 V C = valuation under severe disruption.
The scenario‑weighted valuation is:
𝑉 geo = 𝑝 𝐴 𝑉 𝐴 + 𝑝 𝐵 𝑉 𝐵 + 𝑝 𝐶 𝑉 𝐶 V geo =p A V A +p B V B +p C V C
This 𝑉 geo V geo is your geopolitically adjusted intrinsic value. The difference between 𝑉 geo V geo and the base valuation 𝑉 base V base is the implied geopolitical discount.
Δ 𝑉 geo = 𝑉 base − 𝑉 geo ΔV geo =V base −V geo
Expressing Δ 𝑉 geo ΔV geo as a percentage of 𝑉 base V base gives a clear metric: “this company’s valuation carries an X% geopolitical risk premium relative to a world without these scenarios.”
Step 6 – From valuation discount to risk‑premium metric
To integrate this into standard comparative analysis, convert the valuation discount into an equivalent adjustment to the discount rate or required return.
Conceptually, you can solve for the additional yield (or discount‑rate basis points) that, when applied to the base cash‑flows, reproduces 𝑉 geo V geo . That increment is the “geopolitical risk premium” for that issuer.
For practical purposes, you might define:
- RP geo RP geo = additional annual required return (in basis points) relative to a sector baseline, attributable to geopolitical risk.
Issuers can then be ranked by RP geo RP geo : firms with highly concentrated exposure to sensitive geographies or controls will exhibit larger premiums; those with diversified operations, resilient customer mixes, and robust contingency planning will show smaller adjustments.
Key differentiators across companies
Even with a standardized framework, the geopolitical risk premium varies significantly between semiconductor players. Some key differentiators include:
Geographic footprint of fabs and packaging. Companies whose critical capacity is concentrated in a single high‑risk region warrant higher premiums than those with diversified footprints across more stable jurisdictions.
Customer concentration and market mix. Heavy reliance on buyers in restricted or potentially restricted markets raises the premium, especially if revenues cannot be easily redeployed elsewhere.
Technology and node profile. Providers of highly controlled technologies (e.g., leading‑edge logic or certain equipment categories) face more intense policy risk than firms focused on widely available mature nodes.
Balance‑sheet flexibility. Firms with strong balance sheets and access to multiple funding sources can better absorb shocks from policy changes, lowering their required premium.
Strategic alignment with local industrial policies. Companies deeply integrated with domestic subsidy programs and national‑security narratives may enjoy protective benefits that mitigate some geopolitical downside, even as they remain exposed to policy reversals.
Limitations and practical safeguards
No quantitative model can fully capture geopolitical uncertainty. Several limitations warrant explicit recognition:
Subjective probabilities. Scenario probabilities are judgment‑based and can be biased. Using ranges, stress tests, and sensitivity analysis helps avoid overconfidence in any single estimate.
Non‑linear events. Some geopolitical shocks are non‑linear—low probability but extremely high impact. These may require separate tail‑risk analysis rather than being folded into simple scenario averages.
Feedback effects. Policy responses to industry dynamics (and vice versa) can create feedback loops not captured in static scenarios. The model should be updated regularly as policies and corporate strategies evolve.
Data constraints. Precise data on geographic revenue breakdowns, fab locations, and policy dependencies may be incomplete or lagged, particularly for smaller firms. Assumptions must therefore be documented and treated with care.
Despite these constraints, a structured quantitative approach is still superior to implicit, unexamined adjustments. The goal is not precision but transparency and consistency.
Using the premium in practice
Once computed, the geopolitical risk premium can inform several practical decisions:
Portfolio construction. Investors can cap aggregate exposure to high‑premium names, ensure diversification across firms and regions, or require higher expected returns before adding companies with large geopolitical discounts.
Relative valuation. Comparing premiums across peers highlights which valuations embed more or less geopolitical risk. This can explain differences in multiples that are not accounted for by pure fundamentals.
Engagement with management. Discussions with company leadership can focus on how they mitigate identified drivers and whether strategic changes could reduce the premium—for example, geographic diversification, supply‑chain redesign, or policy engagement.
Risk reporting. Institutions can incorporate the premium into risk dashboards, stress‑test portfolios against scenario shifts, and communicate more clearly about how geopolitical considerations affect investment decisions.
For corporate planners, the same framework can be inverted: by modeling how strategic moves reduce the implied premium, they can quantify the financial value of resilience investments or regional diversification.
Conclusion: formalizing the political shadow over semi valuations
Geopolitical risk is now a structural feature of semiconductor investing, not an occasional disturbance. Treating it as an explicit, quantitatively derived premium brings discipline and transparency to a domain often handled in ad‑hoc fashion. The framework outlined here—base valuation, driver identification, scenario mapping, financial translation, and premium computation—does not eliminate uncertainty, but it makes its treatment consistent and comparable across companies.
As semiconductor supply chains, industrial policies, and security considerations continue to evolve, updating this quantitative model will be as important as the initial design. Those who rigorously integrate a geopolitical risk premium into their valuation toolkit will be better positioned to distinguish between price moves driven by transient sentiment and those grounded in changing political realities—and to align capital allocation with a clear, structured view of the risks that now define the future of the semiconductor industry.